The quality of the product or feature you build on top of transaction enrichment is dependent on the accuracy of the transaction categorisation that underpins it. Michael Cullum, VP of Engineering and Data, explains how we test our categorisation models at Bud, and why it matters.
At Bud, we pride ourselves on being best-in-class in understanding transactional data and using that to help you understand your customers. A key part of our transaction AI is how we categorise transactions: how we determine what a transaction is; is it contents insurance, a salary, a refund or a streaming service subscription, for example?
With the latest release of our categorisation model, we were super-excited about the results. We once again saw improvements to how many transactions it correctly predicts, and how many transactions it’s able to predict.
We commonly use a headline ‘>98% accuracy’ number, but are sometimes asked what that really means in practice. There are a number of different statistical measures behind-the-scenes of how our model performs, and we believe it’s important to explain our methodology to prove that the way we get to those numbers is objective and not biased.
We’ll explain the methodology we use when testing a newly trained model. Separately, we also have a number of techniques we use to monitor a model’s performance in an online setting to compare a new model’s performance in a live setting when they’re deployed, plus to monitor performance on an ongoing basis – but we haven’t covered those here.
Recapping Bud’s categorisation
Bud’s categorisation models are built on the foundation of self-supervised and supervised machine learning, where the model learns from labelled training data. We don’t depend on merchant databases or MCC codes for categorisation – read more about why that helps us achieve such good performance.
We categorise a transaction at three levels:
- L1: high level subjective categories (such as banking, entertainment, and food and drink),
- L2: more granular objective categories (such as groceries or leisure and amusement activities)
- L3: exceptionally fine-grained objective categories (such as convenience stores, supermarkets, food and drink subscriptions or zoos, aquariums, amusement centres, theme parks etc).
Testing: integrity in data
Labelled data includes data from a variety of sources to ensure that Bud’s models can enrich data in different formats with varying amounts of data inputs. This includes aggregated open banking data from different banks and transactions of different types (e.g. bank transfers, ATM withdrawals, credit card transactions).
One of the cornerstones of robust model evaluation is the proper division of data into training, validation and test sets. Bud follows the industry-standard procedure of creating these splits from our labelled data:
- Training set: The training set is used to train the model and consists of 70% of the labelled data.
- Validation set: The validation set is used during training and model iteration to evaluate model performance, consisting of 20% of the labelled data.
- Test set: The test set is used to evaluate the final performance of the model. It’s not used in any way to train or tune the model, representing 10% of the labelled data.
We don't influence which data goes into the test set versus the training/validation sets and, as such, it’s a true representation of the data.
Data quality and coverage are essential for meaningful test metrics in machine learning evaluations. Incomplete coverage can lead to biased assessments, while inaccurate data undermines the accuracy of model evaluations. Ensuring robust data quality and comprehensive coverage is fundamental to obtaining trustworthy insights into a model's performance and guiding effective improvements.
To do this, we use a combination of innovative deduplication techniques, and statistical techniques to maximise the value and volume of our datasets. This ensures that the datasets are all representative of the extreme diversity found within transactional data. It also allows us to ensure the models are feature learners first, with statistical knowledge and not the other way around. This helps us build models that generalise well to new data.
The quality of our labels is then assured through the use of consensus labelling by trained labellers using our in-house labelling tool. This is followed by an extensive suite of analytics and models designed to flag potential incorrect labels for further review.
When we generate performance reports for models (and the numbers you see below) with the test set, we only use the Description, Amount, Currency and Credit/Debit Indicator fields of each transaction – these are the fields we require for any transaction to be put through our categoriser.
We run additional analysis with subsets of the test set by variables such as source or transaction type to ensure there are not significant negative deviations in performance metrics (more than -1%). We also run analysis on using additional features such as location information, transaction type and MCC codes where they are available to ensure that when such additional features are provided they only improve model performance.
Metrics matter: F1, recall, precision and accuracy
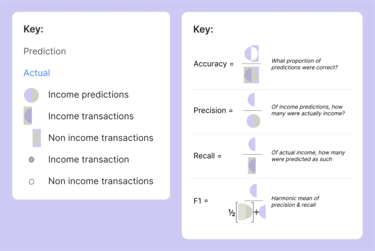
To gauge the effectiveness of our categorisation models, we rely on a comprehensive set of metrics. The F1 score, recall, precision, and accuracy collectively offer a nuanced understanding of the model's performance.
F1 Score
F1 score is the harmonic mean of precision and recall, offering a balanced metric that is the best starting place for understanding performance. You can think of it a bit like a slightly more robust and balanced accuracy.
Recall
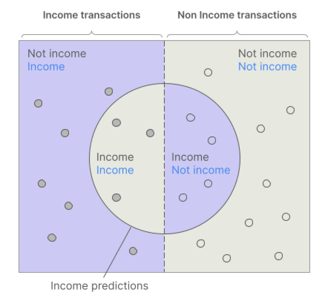
Recall, also known as sensitivity or true positive rate, measures the proportion of actual positives that were correctly identified by the model. High recall indicates that the model is effectively identifying instances belonging to a specific class.
Precision
Precision, or positive predictive value, calculates the accuracy of positive predictions made by the model. High precision indicates that when the model predicts a certain class, it is likely to be correct.
Accuracy
While accuracy provides an overall measure of correct predictions, it can be misleading in imbalanced datasets. Nonetheless, it remains a valuable metric due to its ease of interpretation.
Bud's metrics explained
All of these metrics are calculated in a number of different ways, including: with and without confidence thresholding, macro-averaged, and weighted by custom weightings. But the primary statistics that we use are weighted average by transaction volume, with thresholding applied. This provides the best general purpose, most understandable metrics.
We make sure we don’t just have good topline numbers, but analyse each category at each granularity to ensure that we’re performing well in the categories that matter for the use cases we serve. For example, it’s not useful to a client to have a 98% f1-score on a model, but then perform badly on categories like income, rent or gambling spend in an affordability assessment use case.
Our latest model produced the following performance against our full expanded test set (representative of real-world transaction throughput and not de-duplicated), when using just transaction description, amount and credit/debit indicator:
|
|
L1 |
L2 |
L3 |
|
accuracy |
98.5% |
97.2% |
97% |
|
f1 |
98.9% |
97.7% |
97.6% |
|
precision |
99.3% |
98.4% |
98.4% |
|
recall |
98.5% |
97.2% |
97% |
Performing well where it’s important
Another important tool in our arsenal is the confusion matrix. A confusion matrix is a table used in machine learning to evaluate the performance of a classification model. It provides a detailed breakdown of the model's predictions, comparing them with the actual ground truth. The matrix is particularly useful for understanding the types and frequencies of errors the model makes. In this way, we can understand if there are particular categories that are frequently being confused (which could indicate noise in the training data, or just a particularly tricky class boundary).
Our latest model performance report has the following confusion matrix for L1 categories: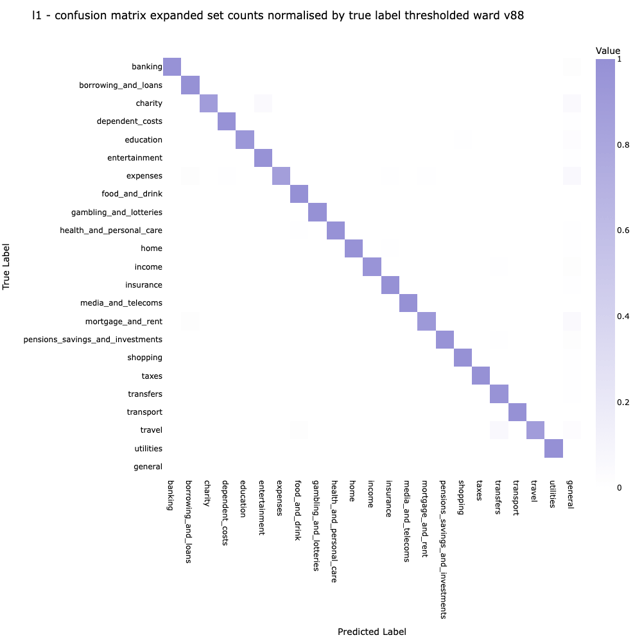
Conclusion: precision, insight, and excellence
At Bud, our testing procedures for categorisation models are designed to give us a complete and accurate picture of the performance of our models at the time of release.
From innovative data preprocessing techniques to advanced analytics during validation and producing final performance metrics, we leave no stone unturned in ensuring the reliability and accuracy of our models.
Bud remains committed to staying at the forefront, delivering categorisation models that not only meet but exceed expectations so that our clients can assess creditworthiness, personalise their customer experience and uncover opportunities to grow with the highest degree of precision possible.
Want to know more about our transaction AI? Talk to our team or schedule a demo.